


Trend Intensity Index Indicator is an MT4/MT5 indicator designed to Determine the exact levels of trend intensity. The Trend Intensity Index is not just about pointing out the trend direction....
Trend Intensity Index Indicator MT4/MT5 FREE Download

Trend Intensity Index Indicator is an MT4/MT5 indicator designed to Determine the exact levels of trend intensity. The Trend Intensity Index is not just about pointing out the trend direction. It is a holistic tool that provides traders with insights about the right entry points, the optimum holding periods, and the most strategic exit points.
The Trend Intensity Indicator is a technical analysis tool used to measure the strength of a trend in the price movement of a security. Developed by M.H. Pee, the TII is designed to identify the beginning and the end of a trend, helping traders make more informed decisions about their trading strategy.
Interpretation:
- Positive values of TII indicate an uptrend, with larger positive numbers representing stronger uptrends.
- Negative values signify a downtrend, with larger negative numbers showing stronger downtrends.
- Values near zero suggest that the market is range-bound or that there isn’t a strong trend.
As with all technical indicators, it’s essential to use the Trend Intensity Index in conjunction with other tools and techniques for the best results.
Trend Intensity Indicator Explained
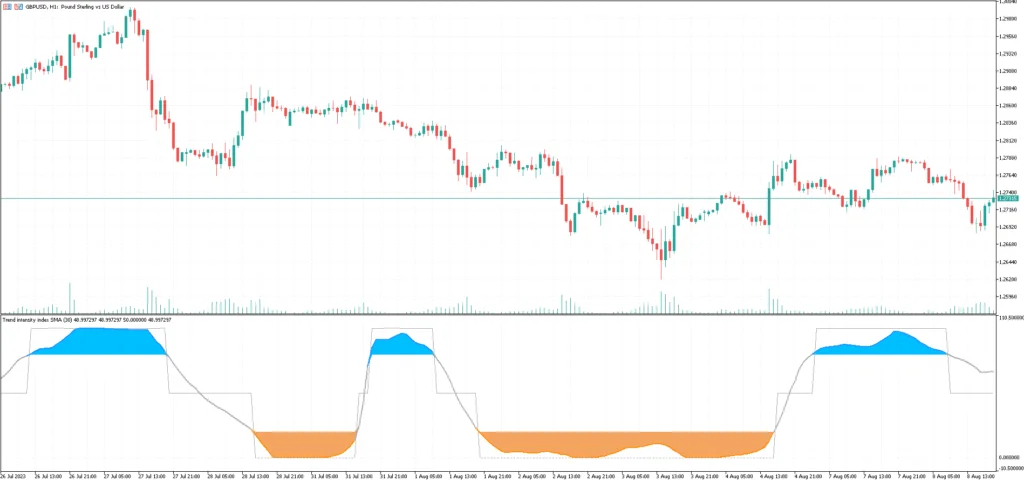
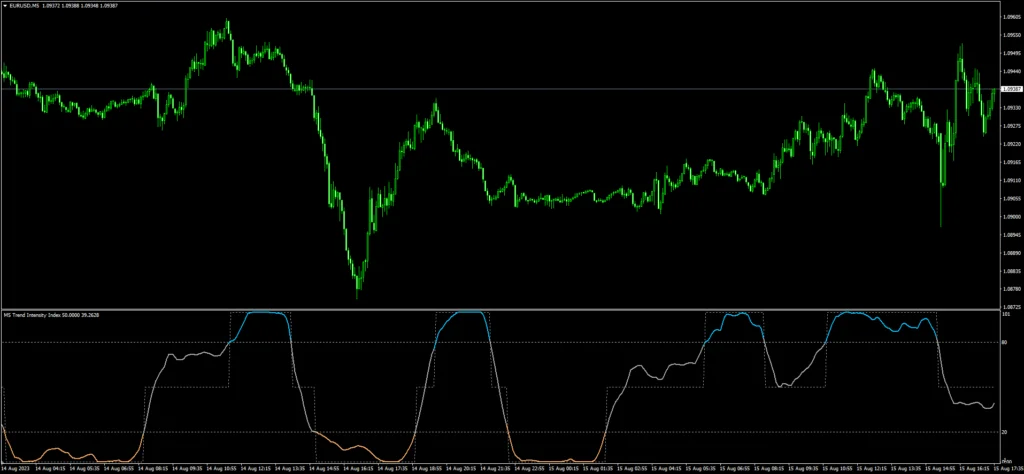
The visualization of the Trend Intensity Indicator is straightforward. It showcases a colored signal line within a separate window, offering trend-based data. Here’s a simple breakdown:
- Oversold Territory: If the index drops below the 20 level and adopts a brown hue, it signifies an oversold market. In such scenarios, traders should be on the lookout for buying opportunities. A subsequent move above the 20 mark, turning the indicator gray, indicates the commencement of an uptrend—ideal for going long.
- Overbought Zone: On the contrary, when the signal line surpasses the 80 mark, the market is potentially overbought. To validate a selling proposition, the line should recede below 80 and transform its color to gray.
- Trending State: The gray line in the Trend Intensity Index is a tell-tale sign of the market’s trending nature. By juxtaposing the market’s bias alongside the signals of trend strength or weakness, traders can meticulously structure their trades from initiation to closure.
For instance, if a trader chooses to go long when the index crosses the 20 levels and turns gray, they can potentially stay in that position until the index crosses the 80 threshold and switches to blue, suggesting an overbought state.
Like all indicators, the Trend Intensity Index is not foolproof. Its performance might waver in choppy or consolidated market conditions. Thus, traders should prioritize those trades that resonate with trend-following market conditions.
This Trend Intensity Indicator can be used on any Forex currency pair and other assets such as commodities, Cryptos, Binary Options, Stock markets, Indices, etc. You can also use it on any time frame that suits you best, from the 1-minutes to the Month charts.

No Minimum Deposit | ||
 | Min Deposit of 20$ |
Download a Collection of Indicators, Courses, and EA for FREE
How Trend Intensity Index Indicator Used in Forex Trading
In Forex trading, the Trend Intensity Index Indicator (TII) can be used to identify and measure the strength of a trend for a currency pair. Given the 24-hour nature of the Forex market and the importance of global economic events, capturing trends can be crucial for traders. Here’s how the TII is typically applied in this context:
- Identifying Trend Direction:
- If the TII is above zero, it indicates a potential uptrend.
- If the TII is below zero, it indicates a potential downtrend.
- Strength of the Trend:
- A higher absolute value of TII indicates a stronger trend. For instance, a TII value of +20 may indicate a stronger uptrend than a value of +10. Conversely, a value of -20 might indicate a stronger downtrend than -10.
- Entry and Exit Signals:
- When TII crosses above zero, it can be interpreted as a potential buy signal or an indication to go long.
- When TII crosses below zero, it can be seen as a potential sell signal or a sign to go short.
- Some traders might also use TII crossovers with a specific threshold as a signal, such as when the TII crosses above +10 or below -10.
- Filtering Noise:
- Given that the Forex market can be highly volatile, it’s essential to filter out “noise” or insignificant movements. Trend Intensity Indicators can help with this. By focusing only on strong TII readings, a trader can potentially filter out insignificant fluctuations and concentrate on more substantial trend movements.
- Combining with Other Indicators:
- Like other indicators, Trend Intensity Index Indicator is most effective when used in conjunction with other tools. For example, using support and resistance levels, Fibonacci retracements, or other momentum indicators like the RSI (Relative Strength Index) or MACD (Moving Average Convergence Divergence) can provide more robust trading signals.
- A trader might, for example, wait for confirmation from another indicator before entering a trade based on a TII signal.
- Setting Stop-loss and Take-profit:
- While TII provides insights into trend strength, it doesn’t offer specific levels for stop-loss or take-profit. However, once a trader has determined the trend’s strength and direction using TII, other technical tools can be employed to decide where to set these orders.
- Divergences:
- As with other momentum indicators, spotting divergences between TII and price action can be valuable. If the currency pair’s price is making higher highs, but the TII is failing to do so, it might indicate weakening upward momentum and a potential trend reversal.
Remember, while the Trend Intensity Index can be a useful tool in the Forex trader’s toolkit, no indicator is infallible. It’s crucial to use it as part of a broader trading strategy, take into account the broader market context, and manage risk appropriately.


Comments
0 comment