


This High Low Indicator is an MT4/MT5 indicator designed to automatically draw Multi TimeFrame High Low levels in MT4 and MT5 terminals. The (Multitimeframe) MTF High Low forex indicator is de...
Multi TimeFrame High Low Indicator MT4/MT5 FREE Download

This High Low Indicator is an MT4/MT5 indicator designed to automatically draw Multi TimeFrame High Low levels in MT4 and MT5 terminals. The (Multitimeframe) MTF High Low forex indicator is designed to draw the previous high and low price levels for TimeFrames on the chart. It serves from today to historical and even custom periods.
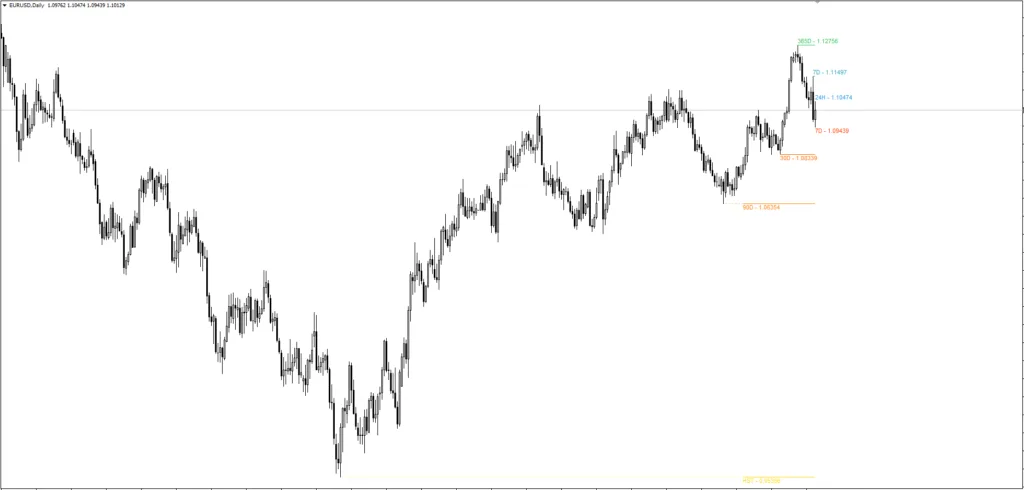
These levels are rendered as lines on the chart, each tagged with the acronym of the period, thereby offering a lucid view of the price movements. Traders can select from various layout options and further embellish the visibility of these levels with dotted projections or price tags.
This MTF High Low MT5 can be used on any Forex currency pair and other assets such as commodities, Cryptos, Binary Options, Stock markets, Indices, etc. You can also use it on any time frame that suits you best, from the 1-minutes to the Month charts.
This MTF High Low isn’t a standalone trading indicator System. Still, it can be handy for your trading as additional chart analysis, to find trade exit position(TP/SL), and more. While traders of all experience levels can use this system, practicing trading on an MT4 demo account can be beneficial until you become consistent and confident enough to go live. You can open a real or demo trading account with most Forex brokers.
This is an entirely free Indicator without any restrictions made by the fxssi.com website. There are more useful free and paid indicators on this website. So check out their other indicators and show some love for the FXSSI Indicators.
How are High Low Levels used in Forex Trading
in the context of forex trading, “high” and “low” refer to the highest and lowest prices at which a currency pair was traded during a given period. Depending on the trader’s perspective and strategy, these could be daily, weekly, monthly, or yearly. Here’s a brief description of each:
- High: This is the highest price level a particular currency pair reaches within a specified period. It represents a peak in price activity.
- Low: This is the lowest price level a currency pair drops to within the same period. It represents a trough in price activity.
The high and low form part of the essential data points used in charting price action for forex trading. These price levels can help traders identify potential resistance (high) and support (low) levels, assess market volatility, and formulate trading strategies. For example, a breakout strategy might involve placing a buy order if the price exceeds the high or a sell order if it falls below the low, anticipating the continuation of the trend.
Key Features of the Multi Timeframe High Low Indicator
The Multi Timeframe High Low Indicator distinguishes itself with its versatility and comprehensive range of functions and features:
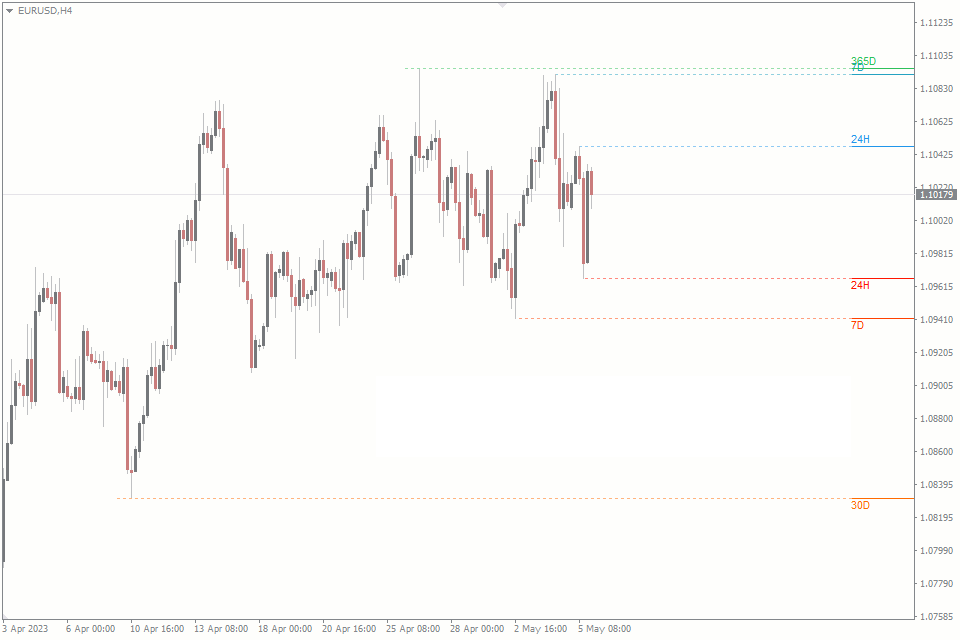
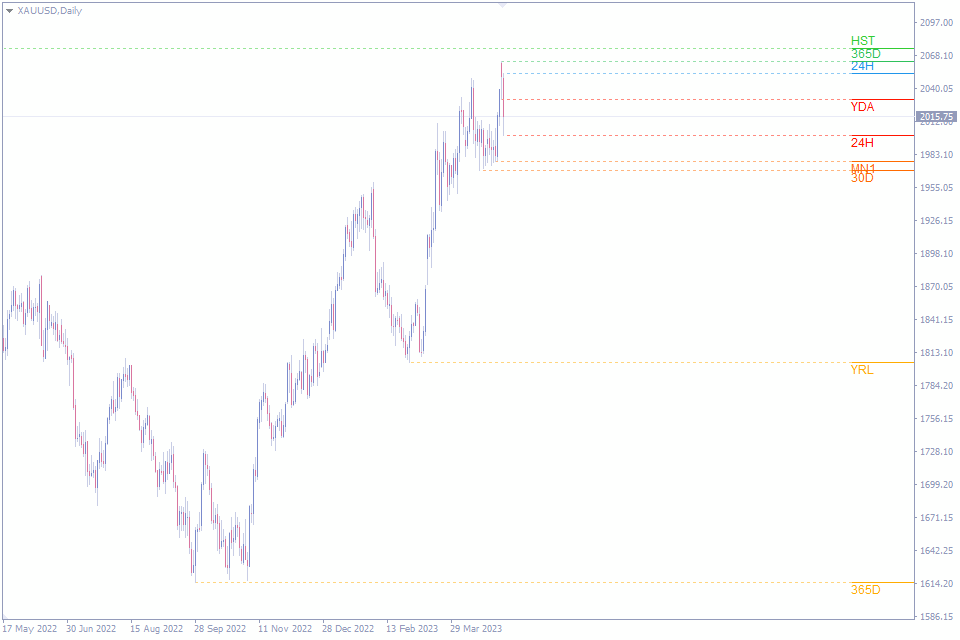
1. Variety of Periods: The indicator draws high and low price levels to display periods such as today, yesterday, daily, weekly, monthly, yearly, and historical. Traders also can establish custom periods, tailoring their trading needs.
The acronyms for the periods are as follows:
- 24H: 24 hours
- 7D: 7 days
- 30D: 30 days
- 90D: 90 days
- 365D: 365 days
- TDY: Today
- YDA: Yesterday
- W1: This Week
- MN1: Month to date
- YRL: Year to date
- HST: Historical
- [n]H: Custom Hours
- [n]D: Custom Days
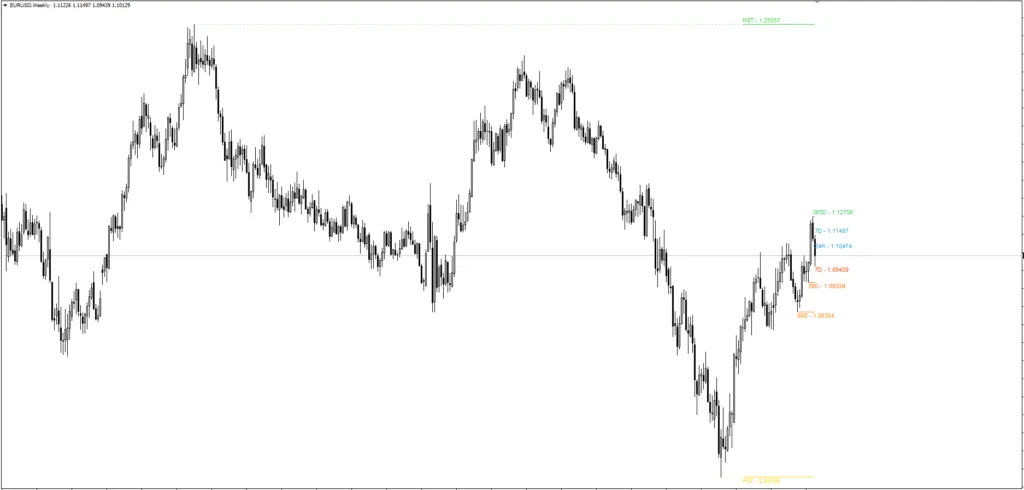
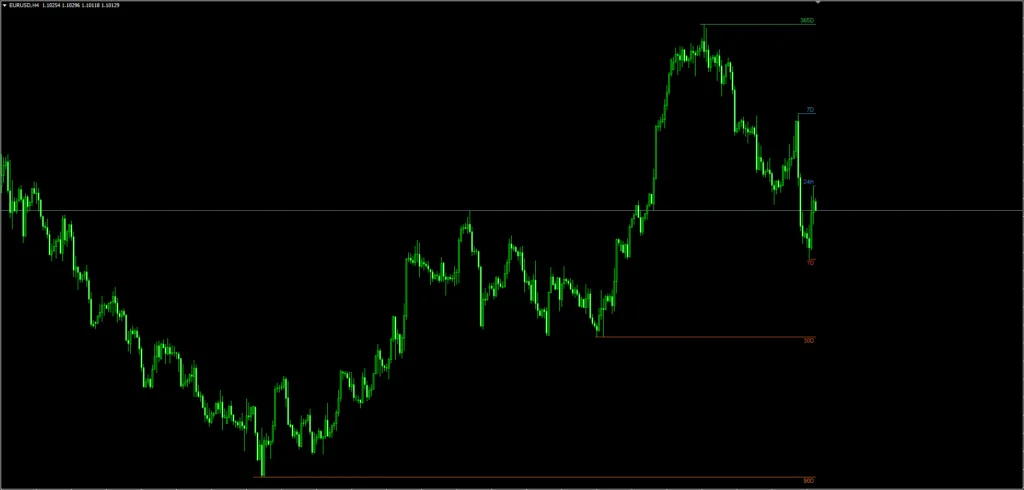
2. Five Layouts: Traders can choose from five different layout options – the right side, the current price (left), the current price (right), full width, or from high/low to the last candle.
3. Visual Customizations: To enhance the visibility of the levels, traders can add dotted projections to the high/low and price tags to exhibit the actual price of the level. Traders can also tweak the text size to meet their requirements. MTF High Low MT5 also offers two prebuilt color templates catering to dark and light backgrounds and a custom preset option to set colors for each line.
Input Parameters
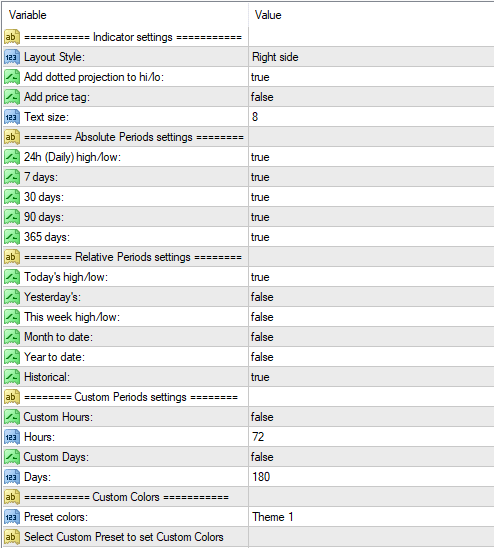
- Layout Style – The Layout Style option allows traders to choose from five display options for their chart’s high and low lines. These options include the right side, the current price (left), the current price (right), full width, and from high/low to price.
- Right side – option places the high and low lines on the right-hand side of the chart.
- Current price (left) – option place the lines on the left-hand side of the current price.
- Current price (right) – option place the lines on the right-hand side of the current price.
- Full width – option stretches the high and low lines across the chart.
- From high/low to price – the option draws a line connecting the high or low point to the right side of the chart.
- Add dotted projection to hi/lo – This option adds a dotted line from the level tag to the respective high or low.
- Add price tag – This option adds the price near the respective high or low acronym.
- Text size – This option adjusts the text size of the level tag.
- Absolute Periods settings – allow you to customize which periods are displayed on the chart. By activating or deactivating specific periods, you can choose to display data for the last 24 hours (Daily), 7 days, 30 days, 90 days, or 365 days.
- Relative Periods settings – allow you to choose which time frames you want to view data based on the current date. You can select from various periods, such as today, yesterday, this week, month to date, quarter to date, year to date, and historical.
- Custom periods settings – This option enables you to set custom periods in days or hours to suit your trading needs.
- Preset colors – This option lets you choose from two prebuilt color templates. Each color preset work both for dark and light backgrounds.
- Custom colors – This option enables you to set colors for each line using the custom preset option.

No Minimum Deposit | ||
 | Min Deposit of 20$ |
Download a Collection of Indicators, Courses, and EA for FREE
Utilizing the High Low Indicator to Spot Key Trading Levels
The High Low Indicator aids traders in identifying key levels of support and resistance across different periods. These levels prove instrumental in spotting potential entry and exit points for trades and can be effectively leveraged to set stop-loss and take-profit levels.
For instance, if the indicator displays the daily high level at 1.2000 and the daily low level at 1.1900, a trader could set a stop-loss at 1.1900 and a take-profit at 1.2000 for a long position. Similarly, if the weekly high level is at 1.2200 and the weekly low level is at 1.1900, these levels can be used to pinpoint potential entry and exit points for a swing trade.
The MTF High Low MT4 is particularly useful in breakout trading strategies. Traders who look for price movements that surge through key support and resistance levels view these levels as harbingers of a potential trend reversal or continuation. If the current price is nearing a key resistance level identified by the indicator, traders may opt for a long position expecting a breakout. Conversely, traders may enter a short position expecting a breakdown if the price nears a key support level.


Comments
0 comment